Saturday, December 25, 2010

The East might be the better conference

The Western Conference has had the better record in interconference games in each of the last ten seasons. That trend has continued into the current season, with the West putting together an impressive 67-50-20 against their Eastern counterparts thus far (games that ended in a shootout are counted as ties). However, upon closer inspection, it would appear that the two conferences are much closer to one another in relation to ability than the results of the interconference games would suggest.

[Note: The data in the table was calculated after removing empty net goals]
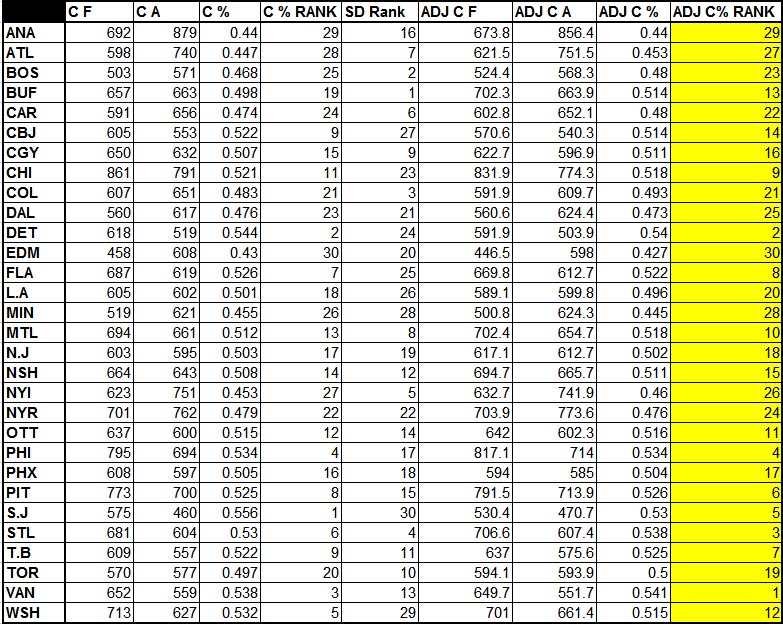
The table pretty much says it all. Firstly, while the West has 12 more non-shootout wins than the East, they're only +11 in terms of goal differential. Generally speaking, a win is worth 5 or 6 goals with respect to net goal differential, so the West should only have about four more wins than the East on merit.

Secondly, the underlying numbers are revealing. The West has done better in terms of the percentages, particularly at even strength, whereas the East has done better virtually everywhere else. Part of the shot differential gap is surely attributable to the fact that Eastern teams have (presumably, given their record) spent more time playing from behind, but it's worth noting the East has still done better with the score close. The East has also been better at generating shots on the powerplay - their six extra PP opportunities can only account for about 15-25% of the shot gap.

Holiday Data Dump


Here's a brief rundown on the contents of the four sheets that can be displayed above.

- the first sheet shows each team's adjusted goal percentage (for all game situations, not just even strength), adjusted Fenwick percentage with the score close, and adjusted Corsi percentage with the score close, in that order. Information on the specifics of the adjustment can be found here.

- the second, third and fourth sheets are self-explanatory.

-all empty net goals have been removed from the data.

Tuesday, November 30, 2010

Adjusted Corsi Update and Goalposts

I've been posting adjusted team Corsi data on a more or less bi-weekly basis over the course of the 10-11 season. As a continuation of that trend, here are the updated numbers. For those that may not be familiar, the following adjustments have been made:
  • only even strength events with the score close (when the score margin is one or zero in the first two periods or tied in the third period and overtime) are included
  • a strength of schedule correction is made with reference to both game location and oppositional strength

[Column abbreviations, from left to right: Corsi For, Corsi Against, Corsi percentage, Corsi percentage rank, Schedule difficulty rank, Adjusted Corsi For, Adjusted Corsi Against, Adjusted Corsi percentage, Adjusted Corsi percentage rank]

I received an email in relation to my last post on the subject regarding the manner in which schedule difficulty is corrected for. I figured that I should post a summary of the methodology involved in case any other readers were curious.

The method is essentially an iterative process. In the first iteration, oppositional strength is calculated with reference to each team's raw Corsi (both for and against) with the score close, and each team's Corsi numbers are adjusted on this basis. The second iteration is identical to the first iteration, except that oppositional strength is calculated with reference to each team's adjusted Corsi, as calculated in the first calculation. Each subsequent iteration proceeds on this basis (i.e. calculating schedule difficulty through the adjusted Corsi data obtained in the previous iteration).

It turns out that ten iterations are sufficient -- the average change in Corsi percentage from the 9th to the 10th iteration is 0.00000043.

Within each iteration, several other adjustments are made that are worth mentioning. Firstly, an adjustment is made in terms of the location of each individual game and whether either team is playing a back to back. Secondly, each individual game is weighted with respect to the total number of Corsi events with the score close. Finally, a correction is made to account for the extent to which each team has contributed to the Corsi percentage of its opponents (this is necessary so that the adjustment does not favour weak teams).


In addition to that, I thought it might be worthwhile to throw up some data on the number of posts that each team has hit thus far, as well as how many times their opponents have struck iron. Vic Ferrari made two posts on this very subject during the 2007-08 season, which I found to be quite interesting then. I'm not sure of the information I'm about to present is all that valuable -- the underlying numbers provide a good indication of which teams have been fortunate or unfortunate, so there's not really any need to rely on goalposts as a proxy for luck. With that said, here's the data.


Based on then above, I think it's fair to characterize the Lightning, the Predators and the Flames as teams that have been unlucky. I'd also include the Wild within that group, given how poorly they've fared on the shot clock so far. On the other end of the spectrum lie the Hurricanes, as well as the Red Wings and the Sharks (the former because of their favorable differential, the latter two because of their favorable differential relative to their shot statistics).

For what's worth, I also ran the numbers for last year. There's been some debate within the hockey blogging world as of late as to whether its appropriate to regard Colorado's 0910 season as lucky. I figure that goalpost data is probably relevant to this issue to some extent, especially among those who reject the validity of Corsi and other shot statistics. Assuming that I haven't made any errors in obtaining the data, the Avalanche hit 27 posts last season, with their opponents hitting 41. Take that for what it's worth.

Tuesday, November 23, 2010

In Defence of Outshooting

David Johnson recently put up a post at his blog that examined the relationship between shot volume, shooting percentage and goals scored at even strength. Specifically, he determined each team's number of Fenwick shots (shots + missed shots) as well as their "Capitalization Ability" (goals scored/Fenwick shots) over the last three regular seasons and how each variable correlated with goals scored over that same period. He then repeated the exercise with respect to Fenwick shots against, save percentage (goals against/ Fenwick shots against) and goal prevention. After presenting his findings, the following conclusion was drawn:
"The conclusion we can draw from these four charts is when it comes to scoring goals, having the ability to capitalize on opportunities (shots) is far more important than having the ability to generate opportunities (getting shots). Controlling the play and generating shots does not mean you’ll score goals (just ask any Maple Leaf fan), having the talent to capitalize on those opportunities is what matters most. From my perspective, this means the usefulness of ‘Corsi Analysis’ to be minimal, at least for the purpose of evaluating players and teams."
At first glance, Johnson's findings and conclusion seem sound enough. For example, if we determine each team's Fenwick differential and Fenwick PDO (Fenwick SH% + Fenwick SV%) over the last three seasons, and look at the correlation of each with each team's even strength goal differential over that same timeframe, the following values are obtained.*

*empty netters were removed from the sample

The results appear to support Johnson's conclusion. The average correlation between outshooting ability (as measured by Fenwick differential) and goal differential is weaker than the average correlation between [shooting + save percentage] and goal differential. As Johnson might put it, the ability capitalize on opportunities and preventing the opposition from doing likewise is more important than having the ability to generate opportunities.

However, Johnson's analysis suffers in that he fails to consider the impact of random variation upon the correlations that he adduces as evidence to support his position. For example, suppose that outshooting was the sole determinant of even strength goal differential, with the percentages merely reflecting the favour (or disfavour) of the hockey gods. If a full NHL regular season was played out under such conditions, we would still expect to observe:

a) a less than perfect correlation between outshooting and goal differential
b) a substantial correlation between the percentages and goal differential

This can be illustrated by simulating the last three NHL seasons a sufficiently large number of times and averaging out the results, using the following parameters:
  • the number of shots taken by a team in any given simulation was the number of Fenwick shots taken by that team during the season simulated
  • conversely, the number of shots taken against that team corresponded to the number of Fenwick shots against it conceded during that year
  • each team's probability of scoring a goal on any particular shot was the league average Fenwick shooting percentage in that particular season (~5.5%).
  • similarly, the probability of conceding a goal on any particular shot was the same for all teams, again corresponding to the league average Fenwick shooting percentage during the season in question
  • after each simulation, the correlation between Fenwick differential and even strength goal differential at the team level was determined and recorded, with the same then being done with respect to [Fenwick shooting percentage + Fenwick save percentage] and even strength goal differential
The results:


So, in the three simulated seasons, the average correlation between Fenwick differential and even strength goal differential was 0.73, whereas the average correlation between [Fenwick shooting percentage + Fenwick save percentage] was 0.67. This is significant for two reasons.

Firstly, even in our imaginary world in which the only way for a team to control its goal differential is through generating and limiting shots, the correlation between the percentages and goal differential is effectively as large as the correlation between outshooting and goal differential. This despite the fact that teams have no ability to influence the former.

Secondly, the simulated values (0.73 and 0.67) are comparable to the actual values (0.54 and 0.61), suggesting that the underlying factors that dictate even strength goal differential in the real NHL are not too different from those that prevail in our simulated world. The relationship between the percentages and outscoring is slightly stronger, and the relationship between outshooting and outscoring slightly weaker, but that's to be expected. After all, we know that:

1. There is a skill component to both even strength shooting percentage and even strength save percentage at the team level.
2. Game score (whether a particular team is playing while tied, from behind or while leading) has an effect on both shot differential as well as the percentages. Over the course of a particular season, the amount of time played in each of these goal states at even strength while vary from team to team.
3. Not all teams adopt the same strategy in relation to playing to the score.

The influence of these last two factors cannot be overstated. For example, if we repeat the above exercise, but use only data from when the score was tied at even strength, the actual results are essentially indistinguishable from the simulated results.


Therefore, the fact that there exists a strong relationship between the percentages and even strength goal differential over the course of a single regular season does not in any way negate the utility of Fenwick, Corsi or even strength shot differential as a measure of a team's ability level. Results at the NHL level are strongly subject to the influence of random variation, even over what might seem like a long period of time (i.e. a single NHL season). Losing sight of this fact - or ignoring it to begin with - can only lead to misguided analysis and flawed conclusions.
.
.

Friday, November 19, 2010

Adjusted Corsi w/ Score Close - Part III

In two previous posts, I showed how each team had performed in terms of Corsi percentage with the score close at that particular point in the season, and then adjusted each team's percentage in order to account for variance in strength of schedule.

While my strength of schedule adjustment corrected for game location (i.e. whether, from a particular team's perspective, the game was being played at home or on the road), it did not account for back-to-games. As it turns out, this was a mistake on my part -- the effect of back-to-games on Corsi (with the score close) is much larger than the effect of game location.


Table Legend
GP = Games played; The number of games played in the 2010-11 season which meet the criterion in the left hand column
R Corsi = Road Corsi; The number of shots directed at the net at even strength by the road team
H Corsi = Home Corsi; The number of shots directed at the net at even strength by the home team
R Corsi % = Road Corsi Percentage; the Corsi percentage from the road team's vantage

The above table shows how game location and whether or not the game is a back to back for either team have interacted to effect Corsi percentage with the score close in games played during the 2010-11 season thus far (up to and including the 268th game).

Some observations:

Firstly, in games in which one team played the night before and the other team did not, the road team carries the burden roughly 75% of the time. I guess the league wants to give the home team every advantage it can without making it seem too obvious.

Secondly, the effect of back-to-back games on Corsi percentage with the score close is considerable -- approximately 0.04. In other words, an average team playing a likewise average team that played the previous night can expect to achieve Corsi results on par with those of the 2009-10 Boston Bruins (a strong, if underrated, team). If the positions are reversed, however, it can expect to perform more along the lines of the 2009-10 Tampa Bay Lightning. That's a sizable difference.

Thirdly, the effect of game location, in and of itself, is pretty small. In games in which both teams are playing on at least one day's rest, the home team only marginally outshoots its counterpart.


With these findings in mind, I decided to modify my method of correcting for scheduling difficulty by accounting for the effect of back-to-back games in addition to game location. Here are the results for all games played as November 17.

More observations:
  • The Capitals raw numbers are ok, but they really get killed by the schedule adjustment. I think that they've played the Thrashers three times already
  • Chicago's numbers might come across as underwhelming, given where they were last year, but they're improved in this regard as the season has progressed. I expect that to continue
  • The Oilers are a real outlier. They're 0.095 from the mean when the next furthest team is a mere 0.064. Things don't look good
  • The Wings may not be what they once were in terms of territorial dominance, but they've still managed to best everyone else. It's hard not to have some degree of admiration for that club

Thursday, November 4, 2010

Adjusted Corsi w/ Score Close - Updated

A couple of weeks back, I put together a post showing how each team had performed thus far in terms of Corsi (shots directed toward the net at even strength) with the score close (whenever the score margin is zero or one in the first two periods, or zero in the third period or overtime) after making an adjustment for schedule difficulty (the method of adjustment is described in the original post).

Here are the updated rankings as of game 177 (VAN@COL). I should note that Game 124 between the Capitals and Hurricanes wasn't included due to the lack of a play-by-play feed.

(Table abbreviations: C F = Corsi For; C A = Corsi Against; C % = Corsi Percentage; SD RANK = Schedule Difficulty Rank (lower values indicate a more difficult schedule); ADJ = Adjusted)


Some observations:
  • Anaheim, Atlanta and Edmonton are terrible
  • If Florida can maintain their pace, they might be the league's most improved team in this respect
  • What's going on in Washington?
  • Neither the Devils nor the Sabres are as bad as their records would indicate, but even this assessment of their abilities isn't all that positive

Wednesday, November 3, 2010

Score Effects and Minor Penalties

The playing to the score effect has received a fair amount of coverage from the more statistically inclined members of the hockey blogosphere over the last two years or so (see here, here and here for some good overviews on the subject). In short, playing from behind tends to have a favourable effect on a team’s shot ratio, whereas playing with the lead tends to have the opposite result. The effect increases linearly as a function of goal margin, and is exaggerated in the third period.

The majority of analysis conducted in relation to the subject thus far has focused on the effect of game score on shot ratio. Little, if anything, appears to have been done in the way of determining the extent to which the effect operates in other aspects of the game. It’s conceivable, for example, that game score could have an analogous effect on team penalty percentage (defined as minor penalties drawn / ( minor penalties drawn + minor penalties taken).

In order to answer the above question, I looked at the NHL.com play-by-play data from the 2007-08 and 2008-09 seasons and created a script on excel to determine how many penalties each team drew and took during that period. However, because I was only interested in penalties that provided one of the teams with a manpower advantage (relative to the situation that existed prior to the penalty was called), I only counted “unique” penalties. I defined a unique penalty as a penalty not accompanied by the calling of any other penalty at that specific point in time. This obviously fails to account for situations where multiple penalties are called and one team emerges with a powerplay, but such situations are rare enough so as to not affect the data materially.


I then determined the goal state prevailing at the time that the penalty occurred – in other words, whether the team that drew/took the penalty was trailing, leading or tied at the time that the penalty was called. Here are the combined results for the two seasons, broken down at the team level.

Evidently, the trailing team does significantly better in terms of penalty ratio than does the leading team. During the period in question, every single team did better in terms of penalty percentage when trailing than when leading. In aggregate, the trailing team drew roughly 54.5% of all penalties, making the magnitude of the effect similar to that observed with respect to shot percentage (the trailing team had an aggregate Corsi percentage of 55.2 during the same timeframe).

One final question remains – does the trailing team earn its penalty advantage on merit, or is it a product of referee bias? Given that the trailing team also enjoys an advantage in terms of Corsi, and therefore spends more time in the opponent’s end than its own (an area of the rink in which a disproportionate percentage of penalties are drawn), one might be inclined to favour the former explanation. However, as demonstrated in the table below, there isn’t much of a relationship between Corsi percentage and Penalty percentage when the score margin is other than zero.

In other words, while the trailing team tends to both outshoot and “outdraw” the leading team, teams that outshoot the opposition by a large margin when playing from behind don’t do significantly better with respect to (trailing) penalty ratio than teams that outshoot the opposition to a lesser extent.

As alluded to above, the second possibility is that the penalty advantage accruing to the trailing team is the result of referee bias. If this explanation is correct, then the team-to-team variation in both leading and trailing penalty percentage would be the product of both randomness and team ability differences in drawing more penalties than the opposition. To test this hypothesis, the following experiment can be performed:

  • taking each team’s penalty percentage with the score tied over the two seasons in question and regressing each value 60% to the mean. The resulting values provide an estimate of each team’s underlying ability to draw more penalties than the opposition. The regression is necessary given that approximately 60% of the team-to-team variation in penalty percentage with the score tied (in the sample of question) can be attributed to luck
  • simulating the two seasons such that every “unique” penalty that occurred when each team was trailing constitutes an individual trial
  • designate the probability of drawing any given penalty as that team’s “true ability” penalty percentage (as determined above) plus 0.045 (0.045 being the magnitude of the referee bias)
  • calculate the average team-to-team spread (standard deviation) in penalty percentage after conducting a sufficiently large number of simulations
  • compare the predicted standard deviation to the actual value
  • repeat the above with respect to all penalties that occurred when each team was leading

The results:

The essentially confirms the above hypothesis in that the predicted standard deviations are virtually identical to the actual values. As such, an analogy can be drawn between the trailing team advantage in penalty percentage and home ice advantage. The probability of a team winning any given game is approximately 5% higher on home ice relative to neutral ice, but all teams benefit from the effect equally (that is, the team-to-team variation in home vs. road winning percentage is entirely random). Similarly, the referee bias in favour of the trailing team appears to be even across the board.

Saturday, October 23, 2010

Corsi Corrected for Schedule Difficulty

While another year of hockey is finally underway, the 2010-11 season is still very much in its infancy. The schedule has yet to reach the 100 game mark, with no team having played more than a handful of games. This being the case, drawing conclusions on the basis of the results thus far can be difficult. The sample size with which we have to work just isn’t large enough.

To illustrate this, consider the league standings as of Friday, October 22nd, following the completion of the 97th game. The range in standing points is 7, with a standard deviation of 2.08. In assigning each team the same winning percentage, setting home advantage at 5%, giving each game a 22% chance of going past regulation, and simulating the first 97 games of the schedule 1000 times under these conditions, the following is obtained.

In other words, virtually all of the team-to-team variation in standings points at this stage of the year is the product of randomness. (For interest’s sake, only about half of the variation in standings points over the course of an entire season can be accounted for by luck.)

As shots in hockey are relatively frequent events, it makes much more sense to rely on a shots-based metric in order to get a sense of how each team has performed thus far. But which metric in particular ought to be used? And which adjustments, if any, are necessary?

Corsi – which includes all attempted shots and therefore better attenuates any sample size concerns – serves as the best fit for this exercise, as opposed to either Fenwick or shot ratio proper. However, two adjustments are necessary. Firstly, playing to the score effects – which are known to bias the shot clock in favour of the trailing team – ought to be controlled for as much as possible. This is especially true this early in the season, as some teams will have played with the lead for much longer periods than others. Ideally, one would restrict the sample to shots attempted at even strength with the score tied in order to get around this problem. However, because of the sample size concern identified above, using Corsi with the “score close” – defined as whenever the score is within one goal in the first or second period, or tied in the third period or overtime – is to be preferred.

Secondly, a team’s Corsi depends not only on its own ability to outshoot the opposition at even strength, but also on the ability of its opponent in this respect. At this point in the year, few teams have played what could be reasonably described as a balanced schedule. Thus, regard should be had to the fact that some teams have faced stronger or weaker opponents with respect to Corsi through incorporating some sort of correction for strength of schedule.

The table below shows each team’s Corsi percentage with the score close and how that changes once an adjustment for strength of schedule is applied.

It’s important to note that, at this point in the year, roughly 43% the team-to-team variation in Corsi percentage with the score tied (raw, not adjusted) can be attributed to luck. Accordingly, some teams will see their ranking change significantly between now and the season’s end. If forced to predict, I’d wager that, relative to underlying talent, the Devils, Bruins, Capitals, Blackhawks and Sharks are better than these rankings suggest. Conversely, I’d wager that the Avalanche, Canadiens, Rangers, Panthers and Flyers are worse.

Friday, May 28, 2010

Stanley Cup Final Prediction and Probabilities


[For an explanation of the table and how the odds were computed, see here].

Not much to say here.

If the regular season was any indication, all three of Chicago's playoff opponents were better teams than the Flyers.

If that doesn't reflect the imbalance between the two conferences, I'm not sure what does.

CHI in 5.


Saturday, May 15, 2010

3rd Round Playoff Predictions and Probabilities


[For an explanation of the table and how the odds were computed, see here].

S.J - CHI

Although Chicago was the better team during the regular season, the Sharks have, to my eye, looked more impressive through the first two rounds. Chicago has simply not been anywhere near as dominant as I would have anticipated.

That said, I thought Chicago was the best team in the conference before the playoffs started, and, while their recent play has produced some doubt in that regard, that belief still holds true.

Thus, I'm going with the Blackhawks to win the de-facto cup final.

CHI in 6.

PHI - MTL

While both of these teams have received some good fortune in order to be where they are right now, the Habs playoff run has been more luck driven. Given that luck doesn't persist over time, this works in the Flyers favor.

Philadelphia may be the weakest opponent that Montreal has faced thus far, but they're still the better team.

I've enjoyed Montreal's playoff run immensely. During my tenure as a serious fan, I had never, before this year, had the opportunity to watch my team advance beyond the second round. Although the circumstances of their advancement leave much to be desired - as any self-respecting fan would prefer to see his team win on merit -, I'm glad that it's finally happened.

I have a feeling that it ends here, though.

PHI in 6.


Wednesday, April 28, 2010

2nd Round Playoff Predictions and Probabilities


[For an explanation of the table and how the odds were computed, see here].

S.J - DET


This series is interesting in the sense that there is no obvious favorite. The Sharks had the better regular season goal ratio by a fair amount, and have about a 65% chance to win if the odds are computed on that basis. On the other hand, the Wings had the better underlying numbers. While both teams were very good at generating shots on the powerplay and moderately good at shot prevention on the penalty kill, the Wings were better at outshooting at EV with the score tied.

I've included an excel document below that contains a list of series from 1993-94 onward where one of the teams had the better pythagorean expectation, and the other the better shot ratio. The team with the better pythagorean expectation is listed under the column heading 'T1', whereas the team with the better shot ratio is listed under the column heading 'T2'. 'W%' denotes pythagorean expectation, whereas 'SR' stands for shot ratio. 'Result' indicates which team won the series. 'W' indicates that the team with the better pythagorean expectation won, while 'L' indicates that the team with the better shot ratio won.

(I realize that shot ratio and the underlying numbers are distinct metrics; however, the data necessary to compute an expected winning percentage based on the underlying numbers just isn't available for the seasons in question. In lieu of that, I think that shot ratio provides an adequate proxy.)


Overall, there were 65 series that satisfied the above criteria. Of those series, the team with the better pythagorean expectation won 35 times, while the team with the better shot ratio won 30 times. This bodes well for the Sharks, I think.

The average difference in shot ratio between the two teams was about 0.12, which is almost identical to the difference between the Sharks and Wings. The average difference in pythagorean expectation was about 0.04, which is less than the 0.07 separating the two teams. Again, I think that this works in San Jose's favor.

On the other hand, the Wings almost certainly aren't a true talent 0.53 team, and it would be foolish to regard them as such.

All things considered, I think that this matchup is pretty close to a cointoss. I'm going with the Wings, if only because I think that the underlying numbers method provides a better measure of a team's true ability than does pythagorean expectation, even though there may or may not be an empirical basis for that viewpoint.

DET in 7.

CHI –VAN

The Canucks are a good team, but I can't help but get the sense that they're a tad overrated. I was browsing Hfboards the other day and I noticed that some 60% of the posters there have picked Vancouver to win the series. To be sure, some of that has to do with the fact that Canucks fans outnumber Hawks fans among HF users. Even so, I found the poll results interesting as the numbers suggest that Chicago is the better team. As posted above, the Hawks are about a 60% shot to win on the basis of adjusted winning percentage, and about a 70% shot if the underlying numbers are used.

The two teams were actually pretty close to one another in terms of regular season goal differential, but the Hawks were much, much better at outshooting. Chicago led the league with a shot ratio of 1.36 (awesome), whereas the Canucks were tenth at 1.05 (meh).

What interests me is how often a playoff team in the Hawks position has performed historically in terms of series wins and losses. That is to say, if two teams are facing one another in the playoffs, and one team has the better regular season shot ratio by a large margin (say, at least 0.2 better), but is only slightly better in terms of pythagorean expectation (say, no larger than 0.08), how often does that team end up winning?

Looking strictly at playoff results between 1993-94 and 2008-09, I found 32 series that met these criteria. I've arranged the series according to date in the excel document below. The headings may require some explanation. 'T1' denotes the team with the better shot and goal ratio, whereas 'T2' denotes their opponent. W% stands for adjusted winning percentage, and SR stands for shot ratio. The 'Results' column indicates which team won the series. 'W' indicates that the team with the better goal and shot ratio won the series, whereas 'L' indicates that the other team won. The bottom column shows the average adjusted winning percentage and shot ratio for the T1 and T2 teams, respectively. As it turns out, the T1 and T2 teams differed, on average, by about 0.03 in adjusted winning percentage and by about 0.3 in shot ratio, which, in both cases, is virtually identical to the gap separating the Hawks and Canucks.


All in all, the T1 team won 19 out of the 32 series, or 58%. That's hardly overwhelming and, to be honest, I would have expected that number to be higher. If the historical results are to given any weight at all, Chicago's chance of winning the series is probably closer to 60% rather than the 70% figure generated by the underlying numbers model.

In any event, the historical results are consistent with my general point that the Hawks ought to be the favorite here. The Canucks have a reasonable chance to win, but it's not somewhat that should be expected in the sense of being more likely than not.

CHI in 6.

PIT-MTL

This pick doesn't require too much deliberation. The Pens might be the best team in the conference, whereas the Habs are easily the weakest squad to advance. Pittsburgh is the heavy favorite regardless of whether the odds are determined through each team's pythagorean expectation or through the underlying numbers. That said, 29% ain't trivial and, as we observed last round, anything can happen over the course of a best-of-seven series.

PIT in 5.

BOS-PHI

I think that these two teams are relatively equal, but that the Bruins are slightly better. It's hard to pick against a team that's as good territorially at even strength as Boston is, even for a Habs fan such as yours truly. To add to that, Savard is expected to return for the series, and that should help them. I expect them to advance.

BOS in 6.

Tuesday, April 27, 2010

The Repeatability of Special Teams Performance

In my post on playoff probabilities, one of the methods in which I calculated each team's expected winning percentage was on the basis of the underlying numbers.

Under this model, shot volume on the powerplay, shot prevention on the penalty kill, as well as penalty differential, were incorporated as determinants of special teams goal differential. However, neither shooting percentage on the powerplay nor save percentage on the penalty kill were used as predictors.

Initially, my intention was to include both variables within the model. However, after looking at the relationship between team powerplay shooting percentage in even numbered games and team powerplay shooting percentage in odd numbered games in the 09-10 regular season, I discovered that there was essentially no correlation. I then did the same thing for the 07-08 season, and the result was the same: no relationship.

I found this to be unusual, given that I had looked at the distribution of powerplay shooting percentage in the past and found that the team-to-team spread was somewhat broader than what one would expect if there was no skill component. Nevertheless, my exercise had revealed the absence of any split-half correlation, thus necessitating the exclusion of PP S% from the model.

(As mentioned above, I also excluded PK save percentage, even though I had not specifically examined its repeatability. This was somewhat unjustified given that, as discussed below, team PK SV% is somewhat repeatable. However, the regression is fairly strong and, even though I ought to have taken it into account, it's exclusion didn't affect things too greatly.)

In any event, my curious findings prompted the following question: To what degree is special teams performance repeatable?

Real Effects

Vic Ferrari had an excellent post about a year ago where he looked at the various components of team even strength performance -- specifically, shooting percentage, save percentage, and shot differential -- and determined the extent to which each component was repeatable. Specifically, his method involved looking at each team's shooting percentage, save percentage, and shot differential, all at EV with the score tied, in 38 randomly selected games from the 2008-09 season. He then looked the same variables over a separate 38 game sample, and determined the correlation between the two sets of games. The exercise was then repeated over 1000 simulations.

The rationale behind the exercise is a simple one -- as expressed by Vic, "if an element of nature is affected by something other than randomness, that it should sustain itself from one independent sample to another." Thus, if the observed correlation is significantly non-zero, it can be assumed that the variable is at least partly determined by factors other than luck. On the other hand, if the observed correlation is insignificantly different than zero, then fluctuations in the variable are assumed to be primarily luck driven.

I decided to apply a similar technique in order to determine the degree to which the components of special teams performance are governed by 'real effects.' Specifically, my methodology involved the following:
  • I obtained special teams data at the team level for each season from 2003-04 to 2009-10
  • Within each season, I looked at team performance on specials teams at the level of individual games
  • In particular, I looked at the following variables: powerplay shooting percentage, penalty kill save percentage, powerplay shot rate (shots for divided by time on ice), penalty kill shot rate (shots against divided by time on ice), and powerplay ratio (the ratio of powerplays drawn to powerplays conceded)
  • However, shooting rates were not examined for 2007-08, 2008-09, and 2009-10, as I was not able to obtain data on PP TOI and PK TOI for those seasons
  • Empty net goals were excluded when calculating shots and goals
  • For each team, I randomly selected 20 home games and 20 road games, combined the two sets of games, and looked at how that team performed within that sample with respect to the above stated variables
  • I then did the same thing for 40 other randomly selected games (again, consisting of 20 homes and 20 road games)
  • I then looked at the correlation between the two sets of games for each of the listed variables
  • I repeated the exercise 1000 times, for each of the six seasons
The results


I should note that the final highlighted column shows the averaged value for each variable.

As indicated by the table, both generating shots on the powerplay and preventing shots on the penalty kill appear to be largely ability driven measures. The same applies to drawing more powerplays than the opposition.

Not surprisingly, both PP S% and PK SV% are less ability driven than the other three variables. It's worth noting that PK SV% appears to be more reliable than PP S%. I presume that this can be attributed to the influence of the goaltender on PK SV%.

Wednesday, April 14, 2010

Corrected Playoff Probabilities

Because I forgot to include EV goals when calculating each team's corsi with the score tied, I decided to re-run the UNDERLYING #'s simulation using the corrected probabilities.

The results aren't too different.

Expected Winning Percentage by Team

In response to a question raised in the comments to my post on playoff probabilities, I figured that it would be useful if I posted each team's expected winning percentage according to the two described methods.

The teams are ranked according to pythagorean winning percentage.


EDIT:

I've altered the chart so as to include even strength goals in the calculation of Corsi with the score tied. The values don't change all that much -- in fact, hardly at all, but I figured that I'd post it if only for accuracy's sake.

Tuesday, April 13, 2010

Playoff Predictions

S.J - COL

The deceptive nature of Colorado’s success this season has been well documented by some of the more statistically inclined members of the hockey blogosphere. As I presume that those reading are familiar with that fact, I won't go into any detail. The Sharks are the better team in virtually every facet of the game, save for perhaps goaltending. As with any series, an upset is always possible, but I think that a lot would have to go wrong for San Jose to lose.

S.J in 5.

CHI –NSH

There isn’t really a lot to be said about this series. I don’t think that the Predators are a bad team, but they have the worst goal differential among the playoff teams in the West. Chicago, on the other hand, is probably the best team in the entire league. They have the best goal ratio once schedule difficulty and empty netters are taken into account, and they were far and away the most dominant team in the league in terms of outshooting. I expect them to advance without too much difficulty.

CHI in 5.

VAN-L.A

I don’t find Vancouver to be all that impressive, but I think that they’re the right pick here. They have the better goal differential, the better shot ratio at EV with the score tied, the better goaltender, and they’ll be starting the series at home. The Kings are respectable and while I suspect that I’ll end up cheering for them here, I just can’t justify picking them in the result.

VAN in 7.

PHX-DET

I’ve taken quite a liking to Phoenix ever since I watched them smoke the Kings on the first Saturday of the season. Imagine my disappointment when I found out that the Red Wings finished 5th. Outside of Chicago, I don’t think that the Coyotes could have asked for a less favourable draw in the first round.

I’ve remarked in the past about how Phoenix has been one of the stronger teams in the league terms of outshooting at EV this year, which is impressive given where they were last season. However, Detroit’s numbers are even better in that respect. Additionally, Detroit’s underlying numbers have improved over the course of the season, whereas the reverse has been true for Phoenix. I’m not sure if that’s terribly relevant to each team’s chances, although it can’t be a good thing from the Coyotes’ perspective.

Finally, the Wings are clearly the better squad on special teams. There isn’t much of a difference between the two teams in terms of shot prevention on the penalty kill, but the Wings are much better at generating shots – not to mention goals – on the PP.

All in all, while I think that the Coyotes are largely legit, they’re clearly overmatched here.

DET in 6.

WSH – MTL

I don’t think that Washington is as strong as its goal differential would imply. However, even if that’s accounted for, they’re still the better team by a substantial margin. Neither club appears to have much of an advantage over the other on special teams, but the Habs get bombed in terms of shots at even strength whereas the Capitals are above average in that respect. The Capitals should dominate the play at even strength and, unless Halak can bail his team out, that should be the difference.

WSH in 5.

N.J – PHI

I agree with Sunny Mehta -- these two teams are reasonably close to one another in terms of ability, but the Devils have a clear advantage in goal. Whereas Brian Boucher has a career even strength save percentage of 0.910, the corresponding figure for Brodeur is 0.922. The true difference in ability is probably larger if one considers that the shot recorder in New Jersey undercounts and that Brodeur has generally been better post-lockout than pre-lockout. Ordinarily I try to refrain from basing a pick on goaltending alone, but when the teams are relatively evenly matched and the gap in goaltender ability is large, I think that it’s reasonable to do so.

N.J in 7.

BUF – BOS

Although the Sabres may have the better record and goal differential, the Bruins strike me as the better team here. The two teams exhibit similar profiles on special teams (good PK, poor PP), but Boston appear to be the better team at even strength. The Bruins were second to only Chicago in terms of outshooting at EV with the score tied, whereas the Sabres were around the league average in this regard. The Sabres actually had the better EV goal differential, but only by virtue of the percentages. I suspect that Boston’s territorial dominance will prevail as the percentages equalize from this point forward.

Some may argue that the Sabres have the better goaltender in Miller, but I’m not sure if that’s necessarily true. Miller finished the season at 0.928 at EV and 0.919 on the PK. His career values are 0.922 and 0.880, respectively. I think it’s reasonable to assume that his career values are more reflective of his ability than this season’s numbers. To the extent that Buffalo has the better goaltending, the difference probably isn’t large.

BOS in 6.

PIT – OTT

This matchup strikes me as the Eastern Conference analog of the Vancouver-LA series. I don’t think that the two teams are that far apart in terms of quality, but the Penguins have the advantage in pretty much every conceivable area that relates to winning – goal differential, outshooting (both in general and at EV), penalty differential, special teams and, as with the Canucks, the higher seed. Although I don’t necessarily think that the Senators will get blown out of the water, there’s simply no rational basis for picking them.

PIT in 6.