- only even strength events with the score close (when the score margin is one or zero in the first two periods or tied in the third period and overtime) are included
- a strength of schedule correction is made with reference to both game location and oppositional strength
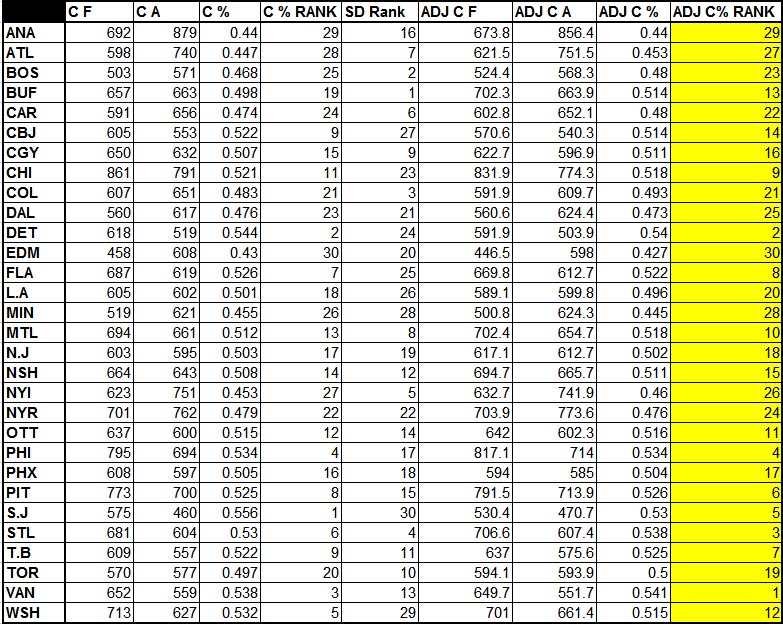
[Column abbreviations, from left to right: Corsi For, Corsi Against, Corsi percentage, Corsi percentage rank, Schedule difficulty rank, Adjusted Corsi For, Adjusted Corsi Against, Adjusted Corsi percentage, Adjusted Corsi percentage rank]
I received an email in relation to my last post on the subject regarding the manner in which schedule difficulty is corrected for. I figured that I should post a summary of the methodology involved in case any other readers were curious.
The method is essentially an iterative process. In the first iteration, oppositional strength is calculated with reference to each team's raw Corsi (both for and against) with the score close, and each team's Corsi numbers are adjusted on this basis. The second iteration is identical to the first iteration, except that oppositional strength is calculated with reference to each team's adjusted Corsi, as calculated in the first calculation. Each subsequent iteration proceeds on this basis (i.e. calculating schedule difficulty through the adjusted Corsi data obtained in the previous iteration).
It turns out that ten iterations are sufficient -- the average change in Corsi percentage from the 9th to the 10th iteration is 0.00000043.
Within each iteration, several other adjustments are made that are worth mentioning. Firstly, an adjustment is made in terms of the location of each individual game and whether either team is playing a back to back. Secondly, each individual game is weighted with respect to the total number of Corsi events with the score close. Finally, a correction is made to account for the extent to which each team has contributed to the Corsi percentage of its opponents (this is necessary so that the adjustment does not favour weak teams).
In addition to that, I thought it might be worthwhile to throw up some data on the number of posts that each team has hit thus far, as well as how many times their opponents have struck iron. Vic Ferrari made two posts on this very subject during the 2007-08 season, which I found to be quite interesting then. I'm not sure of the information I'm about to present is all that valuable -- the underlying numbers provide a good indication of which teams have been fortunate or unfortunate, so there's not really any need to rely on goalposts as a proxy for luck. With that said, here's the data.

Based on then above, I think it's fair to characterize the Lightning, the Predators and the Flames as teams that have been unlucky. I'd also include the Wild within that group, given how poorly they've fared on the shot clock so far. On the other end of the spectrum lie the Hurricanes, as well as the Red Wings and the Sharks (the former because of their favorable differential, the latter two because of their favorable differential relative to their shot statistics).
For what's worth, I also ran the numbers for last year. There's been some debate within the hockey blogging world as of late as to whether its appropriate to regard Colorado's 0910 season as lucky. I figure that goalpost data is probably relevant to this issue to some extent, especially among those who reject the validity of Corsi and other shot statistics. Assuming that I haven't made any errors in obtaining the data, the Avalanche hit 27 posts last season, with their opponents hitting 41. Take that for what it's worth.
3 comments:
Great Stats. Thanks for posting this on a regular basis! (especially since I'm a long abused Vancouver fan!) - One request. There could be some value if we could generate rate stats. Is it possible to post the total time each team played with score close. This would be very interesting to show 'style of play' differences, also indicate really strong Off. & Def. teams.I'm wondering if CA are more important than CF. (My preliminary work suggests this but without similar base unit can't move forward.
Thanks Dan
Rate stats are preferable in theory, but there's one big practical limitation, that being scorer bias. Some rinks employ a much more liberal definition of what qualifies as a blocked or missed shot than others (see my comment made in response to this post at IOF).
This problem could be (mostly) solved through looking solely at road data, although that would reduce the sample significantly.
Still, the questions that you raise are interesting, and seem to be worth investigating. Your suggestion that the number of shots that a team allows might be slightly more reflective of its ability to dictate territorial play than the number of shots it produces makes intuitive sense, as the former would presumably be less sensitive to stylistic factors than the latter.
I'll see what I can come up with.
It is great that you are adjusting your data to improve the way that you present it to us.
Post a Comment