Wednesday, January 26, 2011

Even Strength Outshooting and Team Quality

Readers familiar with the team even strength data that I've published over the course of the season might wonder why I seem to place a large amount of emphasis on even strength shot ratio with the score tied.

After all, only about 35% of league play occurs with the score tied. And of that 35%, one-fifth consists of special teams play. Taken together, that means that time played at even strength with the score tied represents less than 30% of a typical NHL game.

Indeed, if we examine the relationship between a team's even strength shot ratio with the score tied and it's overall goal ratio for every season since the lockout, we find an average correlation of 0.556, meaning that even strength shot ratio only accounts for roughly 30% of the variance in outscoring with respect to a single NHL season.


However, because goals in the modern-day NHL are relatively rare events, a substantial proportion of the team-to-team variation in seasonal goal ratio can be attributed to luck. For example, random variation accounted for 47, 35, and 41 percent of team variation in goal ratio in 2007-08, 2009-10 and 2009-10, respectively.

In a hypothetical season with a sufficiently long schedule, that random variation would eventually disappear, leaving each team with a goal ratio commensurate with its abilities. What each team's goal ratio might look like in such a scenario can be approximated by taking its seasonal statistics - namely, shot ratio, shooting percentage and save percentage - and adjusting them to account for the extent to which each one is affected by random variation.* For both shooting and save percentage, the adjustment is significant as luck accounts for a majority of the variation in respect of both over the course of a single season, as indicated in the table below.


For shot ratio, however, the adjustment is less severe as the impact of randomness is comparatively smaller. Consequently, as the sample size increases, so too does the correlation between shot ratio and goal ratio.

If this exercise is performed for each post-lockout season, one is able to determine the relationship between true goal ratio and even strength shot ratio with the score tied. The results:**


Therefore, in an imaginary league in which luck is a complete non-factor, EV shot ratio with the score tied would account for roughly 65% of the variance in outscoring. In other words, even though the two variables may not be strongly correlated over the course of a single season, a team's EV shot ratio with the score tied serves as a reasonably good indicator of how it can be expected to perform over the long run. This is especially true for the three most recent seasons, in which EV shot ratio accounts for 75% of the variation in outscoring ability. It seems that as the level of parity between teams has increased, even strength shooting has become even more important.

Finally, the remaining 35% of outscoring variance indicates that there are other sustainable components of team success. Apportioning the remaining proportion of the variance between these components gives us an idea of their relative importance.


As special teams ability and EV tied shot ratio are correlated variables, residual special teams skill refers to the proportion of special teams skill that cannot be accounted for by EV tied shot ratio. Residual specials teams skill accounts for about 49% of the remaining variance.

Similarly, residual EV shot ratio refers to the proportion of even strength outshooting that cannot be predicted by EV shot ratio. This accounts for 7% of the remaining variance.

The rest of the remaining variance is explained by even strength shooting, even strength save percentage and residual variance. Residual variance is the amount of variance left over after subtracting the sum of the other four components from 1. It results from the fact that the four components are not uncorrelated, independent variables.


* even strength and special teams statistics were, of course, treated separately for this part of the analysis

**There is an alternative calculation that can be applied as a check on the correctness of these values. As the seasonal reliability of both goal ratio and EV tied shot ratio is imperfect, it is necessary to upwardly adjust the observed correlations between the two variables in order to ascertain their 'true' relationship - that is, the correlation that would result if each variable was perfectly reliable.

The adjustment involves dividing the observed correlation by the square root of the product of each variable's reliability co-efficient. In other words

r adjusted = r observed/ SQRT( reliability EV tied shot ratio* reliability goal ratio )

The application of the above formula involves determining the reliability co-efficients for each variable, which can be calculated as follows:

reliability = 1- [(1- split half reliability)/SQRT(2)]

If these formulae are applied with respect to each post-lockout season, the following results:


The average adjusted correlation is 0.81, which is comparable to the average adjusted correlation obtained through the first method (0.804). It should be noted that this second method is likely to slightly overestimate the true correlation, given that the two variables are not truly independent.

EDIT: Accidentally used Fenwick ratio instead of Shot ratio when determining observed correlations for 2007-08, 2008-09 and 2009-10. Table and accompanying discussion has been edited accordingly.

EDIT 2: In re-thinking the method used in the alternative calculation, it occurred to me that the better way to adjust the observed correlations would be to calculate all three input values at the half-season level.

There's no sense in using the split-half reliabilities in order to estimate the full reason reliabilities for EV shot ratio and goal ratio when the split-half reliabilities can be used themselves, given that the split-half correlation between EV shot ratio and goal ratio is readily ascertained.

This approach produced the following results.*

* the half-season values were calculated through randomly selecting 40 games, randomly selecting another 40 games without replacement, and determining the correlation between the relevant variables across the data sets. This was repeated 1000 times, with the average values used.


.
.

Wednesday, January 19, 2011

EV Data for Games 1 - 692

The spreadsheet that should appear below contains detailed EV data at the team level for games 1 to 692. As NHL.com has inexplicably failed to publish play-by-play data for the following games, they were not included:

Game 124 - WSH@CAR
Game 429 - ATL@NYI
Game 491 - PHX@PIT*

*The play-by-play feed for this game was initially available, but is no longer accessible. Consequently, I have EV and EV close data for this game, but no EV tied data.


[If you're having difficulty viewing the document, click here to view the spreadsheet directly at googledocs.]


A couple of points:

The document contains three worksheets. The first sheet shows even strength data for all situations. The second shows even strength data for when the score was close (i.e. whenever the score margin was 1 or 0 in the first two periods, or tied in the third period or overtime). The last sheet contains data for when the score was tied.

Empty net goals have been removed from the data.

The abbreviations are defined as follows:

GF: goals for
GA: goals against
SF: shots for, where shots = goals + saved shots
SA: shots against
SHOT%: shots for/(shots for + shots against)
SH%: shooting percentage
SV%: save percentage
PDO: shooting percentage + save percentage
FF: fenwick for, where fenwick = shots + missed shots
FA: fenwick against
F%: fenwick for/ (fenwick for + fenwick against)
CF: corsi for, where corsi = shots + missed shots + blocked shots
CA: corsi against
C%: corsi for/ (corsi for + corsi against)
ADJ: refers to the fact that an adjustment for schedule difficulty has been made. See here for the details of the adjustment process.

Finally, as mentioned earlier, I've included EV tied data in this go around. The reason for that is that it appears that score effects are still very much relevant when the score margin is 1 in the first two periods. For example, consider the table below which shows how teams trailing by one goal in the first two periods have performed with respect to shot percentage and PDO over the last three seasons.

In other words, teams trailing by one goal in the first two periods tend to play more aggressively, which increases their shot differential yet hurts their PDO. Additionally, there appear to be strategic differences between teams with respect to style of play when the score margin is one in the first two periods. That's a topic that I plan to explore in more detail in the upcoming weeks.

The result of all of this is that Fenwick or Corsi percentage with the score tied should be a better measure of a team's true ability to control the play at even strength, given that EV score close shot statistics tend to favor teams that play more from behind and/or play more aggressively, relative to the average team, when leading or trailing by one in the first two periods.
.
.
.

Tuesday, January 4, 2011

East vs West Follow Up

In my last post, I included a detailed breakdown of how the two conferences have matched up against one another so far this season and, on the basis of the data, concluded that there wasn't much to choose between them, the West's superior record notwithstanding.

My conclusion was implicitly premised on the assumption that there's no significant skill difference between the two conferences with respect to shooting or save percentage. The rationale behind that assumption was that, while there are talent differences between teams in terms of the percentages, those differences should cancel out when comparing large groups of teams. Without taking a further look at the data, however, it's impossible to determine whether or not the assumption relied on is true.

In determining the above issue, I think that it might be helpful to look at data from interconference games over the last six seasons. I'd delve back further in time, but 2003-04 is the oldest season for which I have advanced statistics at the team level. It's well established that the West dominated the East over this timeframe, as evidenced by the table below. The West had the better record in each of the six seasons examined, with an aggregate winning percentage of 0.54. That's only slightly better than what one would expect on the basis of their goal ratio (its expected winning percentage was 0.536).

[The % column indicates the number of percentage of East wins/goals/shots/powerplay opportunities as a percentage of overall wins/goals/shots/powerplay opportunities. For the post-lockout seasons, games that went to a shootout are considered ties. Empty nets goals have been removed from the data.]

In order to determine the nature of the West's dominance, however, it becomes necessary to take a more granular look at the data. This can be achieved through looking at how each conference has done in terms of shots and the percentages, through breaking down the data by game situation (even strength and special teams), and through looking at data from when the score was tied in order to identify and/or control for playing to the score effects.


[I elected not to include data on shorthanded shots and goals given that shorthanded scoring is neither an important nor sustainable component of team success].

The first thing one might notice is that the West did better than the East across the board - both at even strength and on special teams, and both in terms of shots and the percentages. It was also a fair bit better on drawing penalties, which is noteworthy given that NHL referees tend to favor the trailing team -- Eastern teams presumably would have spent more time playing from behind than Western teams during the games sampled.

However, while the West has technically outperformed the East in respect of shooting percentage, the difference is marginal. Indeed, there's effectively no difference at all at even strength, and while the difference in terms of PP SH% is larger, it's not necessarily reflective of an underlying talent advantage. For example, if the two conferences had the same "true" PP SH%, one would expect one conference to have an advantage of at least 0.004 approximately 50% of the time.

Similarly, the fact that one conference tended to outperform the other in terms of EV SH% in specific seasons should not be construed as meaningful. Random variation requires an average difference of 0.00468 when comparing the shooting percentage of one conference to the other. The actual value? 0.00467.

The success of the Western teams was driven primarily by its outshooting advantage, and this was true at both even strength and on the powerplay. The fact that the data for this season shows no such advantage for Western teams suggests to me that it may no longer be the better conference. While it's true that the West has done better than the East in relation to the percentages, it's difficult to interpret that as a difference in underlying skill for the reasons outlined above.
.
.
.

Saturday, December 25, 2010

The East might be the better conference

The Western Conference has had the better record in interconference games in each of the last ten seasons. That trend has continued into the current season, with the West putting together an impressive 67-50-20 against their Eastern counterparts thus far (games that ended in a shootout are counted as ties). However, upon closer inspection, it would appear that the two conferences are much closer to one another in relation to ability than the results of the interconference games would suggest.

[Note: The data in the table was calculated after removing empty net goals]

The table pretty much says it all. Firstly, while the West has 12 more non-shootout wins than the East, they're only +11 in terms of goal differential. Generally speaking, a win is worth 5 or 6 goals with respect to net goal differential, so the West should only have about four more wins than the East on merit.

Secondly, the underlying numbers are revealing. The West has done better in terms of the percentages, particularly at even strength, whereas the East has done better virtually everywhere else. Part of the shot differential gap is surely attributable to the fact that Eastern teams have (presumably, given their record) spent more time playing from behind, but it's worth noting the East has still done better with the score close. The East has also been better at generating shots on the powerplay - their six extra PP opportunities can only account for about 15-25% of the shot gap.

Holiday Data Dump


Here's a brief rundown on the contents of the four sheets that can be displayed above.

- the first sheet shows each team's adjusted goal percentage (for all game situations, not just even strength), adjusted Fenwick percentage with the score close, and adjusted Corsi percentage with the score close, in that order. Information on the specifics of the adjustment can be found here.

- the second, third and fourth sheets are self-explanatory.

-all empty net goals have been removed from the data.

Tuesday, November 30, 2010

Adjusted Corsi Update and Goalposts

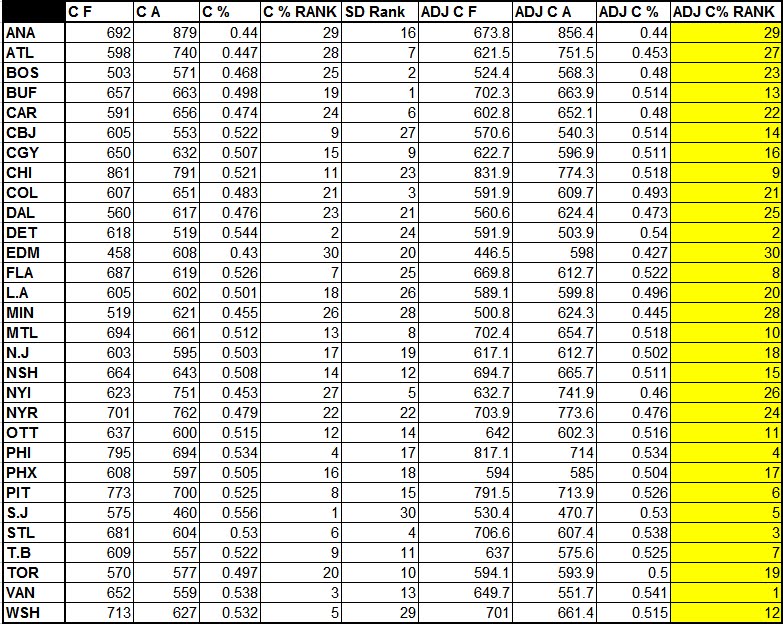
I've been posting adjusted team Corsi data on a more or less bi-weekly basis over the course of the 10-11 season. As a continuation of that trend, here are the updated numbers. For those that may not be familiar, the following adjustments have been made:
  • only even strength events with the score close (when the score margin is one or zero in the first two periods or tied in the third period and overtime) are included
  • a strength of schedule correction is made with reference to both game location and oppositional strength

[Column abbreviations, from left to right: Corsi For, Corsi Against, Corsi percentage, Corsi percentage rank, Schedule difficulty rank, Adjusted Corsi For, Adjusted Corsi Against, Adjusted Corsi percentage, Adjusted Corsi percentage rank]

I received an email in relation to my last post on the subject regarding the manner in which schedule difficulty is corrected for. I figured that I should post a summary of the methodology involved in case any other readers were curious.

The method is essentially an iterative process. In the first iteration, oppositional strength is calculated with reference to each team's raw Corsi (both for and against) with the score close, and each team's Corsi numbers are adjusted on this basis. The second iteration is identical to the first iteration, except that oppositional strength is calculated with reference to each team's adjusted Corsi, as calculated in the first calculation. Each subsequent iteration proceeds on this basis (i.e. calculating schedule difficulty through the adjusted Corsi data obtained in the previous iteration).

It turns out that ten iterations are sufficient -- the average change in Corsi percentage from the 9th to the 10th iteration is 0.00000043.

Within each iteration, several other adjustments are made that are worth mentioning. Firstly, an adjustment is made in terms of the location of each individual game and whether either team is playing a back to back. Secondly, each individual game is weighted with respect to the total number of Corsi events with the score close. Finally, a correction is made to account for the extent to which each team has contributed to the Corsi percentage of its opponents (this is necessary so that the adjustment does not favour weak teams).


In addition to that, I thought it might be worthwhile to throw up some data on the number of posts that each team has hit thus far, as well as how many times their opponents have struck iron. Vic Ferrari made two posts on this very subject during the 2007-08 season, which I found to be quite interesting then. I'm not sure of the information I'm about to present is all that valuable -- the underlying numbers provide a good indication of which teams have been fortunate or unfortunate, so there's not really any need to rely on goalposts as a proxy for luck. With that said, here's the data.


Based on then above, I think it's fair to characterize the Lightning, the Predators and the Flames as teams that have been unlucky. I'd also include the Wild within that group, given how poorly they've fared on the shot clock so far. On the other end of the spectrum lie the Hurricanes, as well as the Red Wings and the Sharks (the former because of their favorable differential, the latter two because of their favorable differential relative to their shot statistics).

For what's worth, I also ran the numbers for last year. There's been some debate within the hockey blogging world as of late as to whether its appropriate to regard Colorado's 0910 season as lucky. I figure that goalpost data is probably relevant to this issue to some extent, especially among those who reject the validity of Corsi and other shot statistics. Assuming that I haven't made any errors in obtaining the data, the Avalanche hit 27 posts last season, with their opponents hitting 41. Take that for what it's worth.

Tuesday, November 23, 2010

In Defence of Outshooting

David Johnson recently put up a post at his blog that examined the relationship between shot volume, shooting percentage and goals scored at even strength. Specifically, he determined each team's number of Fenwick shots (shots + missed shots) as well as their "Capitalization Ability" (goals scored/Fenwick shots) over the last three regular seasons and how each variable correlated with goals scored over that same period. He then repeated the exercise with respect to Fenwick shots against, save percentage (goals against/ Fenwick shots against) and goal prevention. After presenting his findings, the following conclusion was drawn:
"The conclusion we can draw from these four charts is when it comes to scoring goals, having the ability to capitalize on opportunities (shots) is far more important than having the ability to generate opportunities (getting shots). Controlling the play and generating shots does not mean you’ll score goals (just ask any Maple Leaf fan), having the talent to capitalize on those opportunities is what matters most. From my perspective, this means the usefulness of ‘Corsi Analysis’ to be minimal, at least for the purpose of evaluating players and teams."
At first glance, Johnson's findings and conclusion seem sound enough. For example, if we determine each team's Fenwick differential and Fenwick PDO (Fenwick SH% + Fenwick SV%) over the last three seasons, and look at the correlation of each with each team's even strength goal differential over that same timeframe, the following values are obtained.*

*empty netters were removed from the sample

The results appear to support Johnson's conclusion. The average correlation between outshooting ability (as measured by Fenwick differential) and goal differential is weaker than the average correlation between [shooting + save percentage] and goal differential. As Johnson might put it, the ability capitalize on opportunities and preventing the opposition from doing likewise is more important than having the ability to generate opportunities.

However, Johnson's analysis suffers in that he fails to consider the impact of random variation upon the correlations that he adduces as evidence to support his position. For example, suppose that outshooting was the sole determinant of even strength goal differential, with the percentages merely reflecting the favour (or disfavour) of the hockey gods. If a full NHL regular season was played out under such conditions, we would still expect to observe:

a) a less than perfect correlation between outshooting and goal differential
b) a substantial correlation between the percentages and goal differential

This can be illustrated by simulating the last three NHL seasons a sufficiently large number of times and averaging out the results, using the following parameters:
  • the number of shots taken by a team in any given simulation was the number of Fenwick shots taken by that team during the season simulated
  • conversely, the number of shots taken against that team corresponded to the number of Fenwick shots against it conceded during that year
  • each team's probability of scoring a goal on any particular shot was the league average Fenwick shooting percentage in that particular season (~5.5%).
  • similarly, the probability of conceding a goal on any particular shot was the same for all teams, again corresponding to the league average Fenwick shooting percentage during the season in question
  • after each simulation, the correlation between Fenwick differential and even strength goal differential at the team level was determined and recorded, with the same then being done with respect to [Fenwick shooting percentage + Fenwick save percentage] and even strength goal differential
The results:


So, in the three simulated seasons, the average correlation between Fenwick differential and even strength goal differential was 0.73, whereas the average correlation between [Fenwick shooting percentage + Fenwick save percentage] was 0.67. This is significant for two reasons.

Firstly, even in our imaginary world in which the only way for a team to control its goal differential is through generating and limiting shots, the correlation between the percentages and goal differential is effectively as large as the correlation between outshooting and goal differential. This despite the fact that teams have no ability to influence the former.

Secondly, the simulated values (0.73 and 0.67) are comparable to the actual values (0.54 and 0.61), suggesting that the underlying factors that dictate even strength goal differential in the real NHL are not too different from those that prevail in our simulated world. The relationship between the percentages and outscoring is slightly stronger, and the relationship between outshooting and outscoring slightly weaker, but that's to be expected. After all, we know that:

1. There is a skill component to both even strength shooting percentage and even strength save percentage at the team level.
2. Game score (whether a particular team is playing while tied, from behind or while leading) has an effect on both shot differential as well as the percentages. Over the course of a particular season, the amount of time played in each of these goal states at even strength while vary from team to team.
3. Not all teams adopt the same strategy in relation to playing to the score.

The influence of these last two factors cannot be overstated. For example, if we repeat the above exercise, but use only data from when the score was tied at even strength, the actual results are essentially indistinguishable from the simulated results.


Therefore, the fact that there exists a strong relationship between the percentages and even strength goal differential over the course of a single regular season does not in any way negate the utility of Fenwick, Corsi or even strength shot differential as a measure of a team's ability level. Results at the NHL level are strongly subject to the influence of random variation, even over what might seem like a long period of time (i.e. a single NHL season). Losing sight of this fact - or ignoring it to begin with - can only lead to misguided analysis and flawed conclusions.
.
.