Tuesday, May 10, 2011

Team Effects and Penalty Kill Save Percentage

In yesterday's post, I looked at the extent to which team effects contribute to the variation in even strength save percentage between individual goaltenders.

The results were somewhat inconclusive. On the one hand, the inter-year correlation for even strength save percentage is no stronger for goalies remaining with the same team when compared to the value for goalies that changed teams. This suggests that team effects are negligible.

On the other hand, there is a statistically significant correlation between the even strength save percentage of starters and backups. Moreover, the magnitude of the correlation is moderate when viewed in light of the fact that even strength save percentage exhibits low reliability over the course of a single season. This suggests that team effects are important.

The purpose of this post is to look at whether -- and if so, to what extent -- team effects play a role with respect to penalty kill save percentage. The same methods used in yesterday's post will be applied here. If readers are interested in the specifics of each method, I'd encourage a reading of the original post, in which the calculation steps are set out in some detail.

Firstly, a comparison of goalies that changed teams to goalies that remained with the same team. Here's a summary of what this method entails:

Goalies that played for more than one team in a single season were excluded. No minimum shots faced cutoff was employed. However, because some of the goalies in the sample faced very few shots in a given season, I used a weighted correlation in which the weight assigned to each season pair was the lower number of shots faced in the two seasons used...[a]dditionally, because the league average [PK SV%] was not uniform over the period in question, I adjusted each goalie's raw [PK SV%] by dividing it by the league average [PK SV%] in that particular season.
The results:


No evidence for team effects here. The correlation for goalies that changed teams is actually larger, although the difference is not statistically significant.

Next, determining the correlation between starters and backups. Again, a refresher as to the specifics of the method involved:

I separated starting goaltenders and backup goaltenders into two groups. A starting goaltender was defined as the goaltender that faced the most shots for his team in a particular season. All other goaltenders were defined as backups, except for goaltenders that played for more than one team in a season, who were excluded from the sample. Just like in the first method, the [PK SV%] for all goaltenders was adjusted by dividing same by the league average [PK SV%] in the particular season. I then determined the weighted correlation between the [PK SV%] of a team's starter with the collective [PK SV%] of his backups. The weight assigned to each data pair was the lower number of shots faced by either the starter or his backups. So, for example, if the starter faced 1000 shots, and his backups collectively faced 1400, the weight would be 1000.

The application of the above steps yields a correlation of 0.07 over 340 data pairs, a value which is not statistically significant - there's a roughly 19% chance that a correlation that large or larger could occur by chance alone. That said, given the low number of shots faced on the penalty kill by the average goaltender over the course of a single season, it is not possible to obtain a statistically significant correlation between starters and backups unless team effects accounted for a substantial percentage of the non-luck seasonal variation in PK SV%. For example, a correlation of 0.10 - which would barely be significant at the 5% level - would imply a very large role for team effects, given that PK SV% for individual goaltenders has a low seasonal reliability (see the next paragraph).

Proceeding on the assumption that the correlation between starters and backups is reflective of a true relationship, the next step is to compute the seasonal reliability co-efficients for each variable. I obtain approximate values of 0.28 for starters and 0.07 for backups. This implies a true correlation of 0.50.

Finally, I have goaltender data at the individual game level for the last three seasons against which the plausibility of the above results can be checked. The penalty kill data I have is inclusive of 4-on-5 situations only, but that shouldn't make a huge difference. The table below displays the split-half reliabilities for starter and backup PK SV%, as well as the split-half correlation between the two variables, both of which have been averaged over 1000 trials.
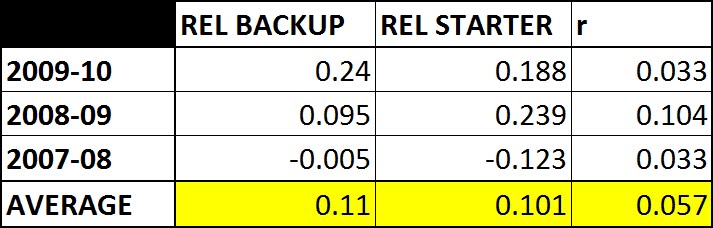
These values imply a true correlation of 0.54, which is consistent with the results of the second method.

So there you have it - comparing goalies that switched teams to goalies that remained with the same team suggests team effects are unimportant in relation to PK SV%. But there is a positive correlation between the PK performance of starters and backups, which indicates that team effects are relevant. Those who read yesterday's post will be aware that the data for even strength save percentage tells the same story.

Interestingly, the data suggests that team effects may be more important at even strength than on the penalty kill. This is unusual as penalty kill save percentage at the team level is somewhat more reliable than even strength save percentage, once you control for the disparity in sample size - that is, the fact that a team faces many more shots at even strength than it does on the penalty kill.
.

Team Effects and Even Strength Save Percentage

The extent to which a goaltender's team has an impact on his save percentage - and, in particular, his even strength save percentage - has received some attention in the hockey blogging world in the past - see here and here for some good articles.

One way in which team effects on even strength save percentage (EV SV%) can be gauged is to compare goalies that changed teams to goalies that remained with the same team. This can be done through creating two groups of goalies on the basis of the above criterion, and looking at how well EV SV% repeats from one year to the next for each group. If the correlation for the group of goalies that changed teams is significantly smaller than the correlation for the group of goalies that remained with the same team, then that would be evidence of team effects.

Using a spreadsheet kindly supplied by Geoff Detweiler, I performed the above exercise with respect to goaltender data from 1997-98 to 2010-11. Goalies that played for more than one team in a single season were excluded. No minimum shots faced cutoff was employed. However, because some of the goalies in the sample faced very few shots in a given season, I used a weighted correlation in which the weight assigned to each season pair was the lower number of shots faced in the two seasons used. Thus, if a goalie faced 1600 EV shots in one season, and 400 in the next, the weight assigned to the season pair would be 400.

Additionally, because the league average EV SV% was not uniform over the period in question, I adjusted each goalie's raw EV SV% by dividing it by the league average EV SV% in that particular season. Here are the results:

[ n refers to the number of season pairs in each group ]

The correlations are scarcely distinguishable, which implies that team effects aren't important at even strength. This essentially replicates what Vic Ferrari found when performing similar analysis a few years ago.

Of course, that doesn't necessarily settle the issue. For example, another approach would be to look the relationship between the EV SV% of a team's starting netminder and the collective EV SV% of its backups. If the two variables are positively correlated, then that implies the existence of team effects.

The advantage of this method is that it allows for team effects to be measured more directly by examining the relationship between the variables of importance at the within-season level. This is significant as team effects on save percentage - to the extent that they do exist - may not repeat overly well from one season to the next. For example, Tom Awad, in an excellent article written last year, found that while team differences in shot quality over the course of a single season were much larger than what would be predicted from chance alone, the metric exhibited weak season-to-season repeatability.

Using the same goaltender data referred to earlier, I separated starting goaltenders and backup goaltenders into two groups. A starting goaltender was defined as the goaltender that faced the most shots for his team in a particular season. All other goaltenders were defined as backups, except for goaltenders that played for more than one team in a season, who were excluded from the sample. Just like in the first method, the EV SV% for all goaltenders was adjusted by dividing same by the league average EV SV% in the particular season. I then determined the weighted correlation between the EV SV% of a team's starter with the collective EV SV% of his backups. The weight assigned to each data pair was the lower number of shots faced by either the starter or his backups. So, for example, if the starter faced 1000 shots, and his backups collectively faced 1400, the weight would be 1000.

After doing all of that, I obtained a correlation of 0.156. With 340 data pairs, the probability of a correlation that large materializing by chance alone is very small - slightly under 1%, in fact. Moreover, it cannot be accounted for by shot recording bias.* Therefore, it would appear that the EV SV% of individual goaltenders is affected to some degree by team effects. The question that must now be answered is this: how large is the effect?

As discussed before on this blog, the fact that two variables are weakly correlated over a given sample does not in itself mean that there is no strong underlying relationship between those variables. For example, if each of the variables exhibits low reliability over the sample in question, a weak correlation may in fact indicate a close underlying relationship. Thus, ascertaining the reliability values of the two variables is critical in interpreting the significance of the correlation between them.

Applying this to our value of 0.156, it becomes necessary to determine the seasonal reliability co-efficients of both starting goalie EV SV% and backup EV SV%. While it is not possible to perform this calculation directly,** it can be approximated by simulating seasons to match the spread of the averaged observed results and noting the average correlation between such seasons. Using this method, the approximate reliability co-efficients are 0.33 for starter EV SV% and 0.22 for backup EV SV%.

These values imply that the true correlation between the two variables is roughly 0.58. Assuming that both variables are normally distributed***, this means that the variation in one variable would be able to explain 33% of the variation in the other over the long run, suggesting that team effects are important.

As a final note, this post was intended to generate discussion more than anything. Comments demonstrating flaws in my reasoning and/or methodology are welcome, as is the presentation of contrary evidence.


* Shot recording bias causes the save percentages of goalies playing for the same team to be more similar to one another than what would be the case if shots were recorded in the same in every rink. However, because of a) the small number of shots taken over the course of the season, b) the relatively mild nature of the bias, and c) the fact that half of all games are played on the road, the effect is fairly minor. Of the observed correlation of 0.156, only 0.018 can be attributed to shot recording bias.

** Ordinarily, and as I've done in the past, I would calculate the split-half reliability values for each variable and then calculate the split-half correlation between them. This method is superior as no approximation is necessary with respect to determining the reliability co-efficients. Unfortunately, EV SV% data at the individual game level is required in order to do so. As such data is only available for 2007-08 onward, I'm only able to apply this method to the years of 2007-08, 2008-09 and 2009-10 (and even then, for 5-on-5 play rather than all EV situations). Here are the results:

The results imply that team effects have a very important role in relation to 5-on-5 SV% - indeed, that there would be a perfect correlation between the 5-0n-5 SV% of starters and backups in the long run! This being an obvious absurdity, I think it's preferable to ignore this and concern ourselves with the results from the larger 12 year sample instead.

*** This is merely a simplifying assumption. In reality, it is unlikely that either variable is normally distributed.


Sunday, May 1, 2011

Loose Ends - Part III C: The Power Play


[EDIT: The table relating to the penalty kill was labeled incorrectly and suggested that I was looking at shorthanded scoring ( I accidentally put 'PKSF/60' and PK 'GF/60' instead of PKSA/60' and PKGA/60, respectively). The table has now been fixed.]

This post is a tad overdue.

It's the second of two follow up posts relating to powerplay performance. While the first post dealt with the relationship between shooting percentage at even strength and shooting percentage on the powerplay, this post relates to predicting future powerplay performance.

The variation in powerplay shooting percentage at the team level, over the course of a single regular season, is approximately 90% luck, 10% skill. Not surprisingly, powerplay shot rate is a stronger predictor of future powerplay performance than raw powerplay performance (provided that the sample size with which one is dealing isn't overly large). This is precisely what Gabriel Desjardins demonstrated in a post published in early April.

What this post is concerned with, however, is whether the inclusion of missed and blocked shots in the sample has residual value with respect to predicting to predicting powerplay efficiency in the future. While such is the case at even strength, special teams may be a different ballgame. What does the data say?

One preliminary issue that must be dealt with is shot recording bias. Recording bias doesn't really present a problem with respect to even strength shot metrics due to the fact that:

A. What were ultimately interested in is shot ratio/percentage or shot differential, and
B. None of the scorers appear to favor one team over the other (i.e. recording bias is largely, if not entirely, symmetrical).

Not so with special teams. With special teams, we're generally interested with rate stats, in which case recording bias becomes relevant. This is especially true when it comes to the recording of missed and blocked shots. Below is a table showing each team's home/road ratio in recorded shots (saved shots + goals), misses and blocks over the last three regular seasons (from 2008-09 to 2010-11). All game situations were included, although empty net goals or shots that resulted in same were not.


As one might notice, the recording of shots that actually make it to the goal isn't that bad. New Jersey and Minnesota appear to undercount, and Colorado appears to overcount. But every other location is reasonably good.

The recording of misses and blocks, by contrast, is generally fucked up. The N.J, CHI, ATL and BOS scorers seem very reluctant to record misses. Conversely, the guys in L.A, CAR, DAL and TOR seem overly eager.

The data for blocks reveals a similar story. The scorers in ANA, BOS, FLA and N.J count too few, whereas the scorers in NYI, MTL, EDM, S.J, TOR and WSH count too many.

It's a god damn nightmare.

Fortunately, there is a solution. Recording bias can be more or less controlled for by dividing the observed number of home missed or blocked shots by the appropriate co-efficient (that being the applicable H/R ratio, as displayed in the above table).

Once this correction is made, one can determine whether including missed and blocked shots adds value with respect to predicting future powerplay performance.

The following experiment was performed:

- I randomly selected 40 games from the 2010-11 season
- I calculated each team's PP GF/60, PP SF/60, PP Fenwick/60, PP Corsi/60 over that selected sample
- PP Fenwick/60 = [(powerplay shots + powerplay missed shots)/PP TOI]*60
-
PP Corsi/60 = [(powerplay shots + powerplay missed shots + powerplay blocked shots)/PP TOI]*60
- I then selected an independent 40 game sample, and calculated each team's PP GF/60 in respect thereof
- I then looked at how each of the four above variables ( PP GF/60 , PP SF/60, PP Fenwick/60, PP Corsi/60), as calculated over the 1st sample of games, predicted PP GF/60 over the 2nd sample of games
- I repeated this exercise 1000 times
- I then repeated the entire exercise for the 2008-09 and 2009-10 regular seasons

The results:


Just like Gabe Desjardins found, shot production is a better predictor of future powerplay success relative to raw performance (with respect to 40 game sample sizes). And while missed shots have some informational value, blocked shots do not.

Does the same apply to the penalty skill? Interestingly, no.


Unlike with the powerplay, raw performance on the penalty kill (over a 40 game sample) is a superior predictor of future PK performance than is shot prevention. Part of that can be attributed to the fact that penalty skill save percentage is considerably more reliable than powerplay shooting percentage.

Furthermore, including misses and blocks is of no assistance. It seems as though better penalty kills force their opponents to take a greater proportion of missed and blocked shots.


Thursday, April 28, 2011

2nd Round 1011 Playoff Probabilities and Predictions


[ For an explanation, see here ]

VAN - NSH

The Canucks get a slightly easier draw here as compared to round one. The skill difference between these teams is smaller than what the regular season results would imply, but Vancouver is clearly better and should advance.

Van in 5.

S.J – DET

Pick em'. The odds in the table above suggest that the Sharks have the edge, but I reckon that these two teams are pretty even to one another. I'll take San Jose because of home ice.

S.J in 7.

WSH-T.B

These two teams are pretty close, with the numbers suggesting that Washington is slightly better. Combine that with the fact that my instinct says that the Caps are a better team than the numbers show (based on roster composition and past performance), and I'm left with no choice but to take them.

WSH in 6.

PHI-BOS


Like S.J-DET, I suspect this is pretty close to a coinflip. I'll concede that Philly appears to have the better team on paper, but the numbers favor Boston. I'll take the Bruins in seven games.

BOS in 7
.

Thursday, April 14, 2011

Playoff Outcome Probabilities


Self Explanatory. Based on each team's expected winning percentage, as shown here.
.

Wednesday, April 13, 2011

1st Round 1011 Playoff Predictions

VAN - CHI

I reckon the Blackhawks are the strongest 8th seed that the league has seen since the current playoff format was adopted in 1994 (runner up: 1995 New York Rangers). Very tough matchup for Vancouver, especially considering that they could have easily drawn a substantially inferior club in the Stars. All of that said, I'm going with Vancouver here. While the Canucks probably aren't as strong as their regular season numbers would suggest, they still appear to be the league's best team.

VAN in 7.

S.J –L.A

As I mentioned a few days ago, San Jose has been simply outstanding since the halfway mark. While the Kings are respectable, they're in tough here given their injuries to key players and the quality of the opponent. I expect San Jose to advance.

S.J in 5.

DET-PHX

I like both of these teams so I'm disappointed that one of them will be out when the dust settles. The evidence suggests that Phoenix will be that team. Detroit is better territorially at EV and considerably better on special teams. The Coyotes will require more than a few things to go right for them in order to win.

DET in 5.

ANA-NSH


Of the four Western series, this one captures my interest the most. I think that Anaheim is far and away the worst team to qualify this year. While their special teams seem to be above average, they were dead last in the entire league in terms of corsi ratio. The Predators, on the other hand, are competent on special teams and an average to above average club at evens. Not a difficult pick.

NSH in 6


WSH – NYR

Like in the case of VAN-CHI, these two teams are closer in ability to one another than is typical in a #1-#8 matchup. I find that the Rangers are a hard team to get a read on. Even though they're decidedly below average territorially at EV, I really like their team on paper - the forward group, in particular. Their regular season scoring chance numbers are also very good.

All things considered, I'm going to trust my model and go with the Caps.

WSH in 6.

PHI – BUF

This series doesn't really appeal to me all that much. Despite their recent struggles, and Buffalo's improved play over the course of the year, Philadelphia strikes me as the better team. I see them narrowly edging the Sabres here.

PHI in 7.

BOS – MTL

Results notwithstanding, the Canadiens might be the league's most improved team this year, given the way that they were manhandled last year in terms of shots and scoring chances. They're actually better than Boston with respect to outshooting at even strength, which I find surprising in light of last year's numbers.

The Bruins are my pick, though. I think they have the better team on paper, not to mention the fact that my model also has them as the better team.

BOS in 7.

PIT – T.B

Given Pittsburgh's injuries to two of its best players, I figure this series is pretty close to a coin flip. I prefer Pittsburgh on the basis of Crosby's potential return to the lineup and the fact that their underlying numbers remained very strong down the stretch

PIT in 7.
.

1st Round 1011 Playoff Probabilities


The information in the table is pretty straightforward - it simply shows each team's probability of advancing as well as the probability of winning in a particular number of games. So, for example, Vancouver has a 61.8% chance of advancing and a 9% chance of doing so in a sweep.

The manner in which the odds were computed, however, requires some explanation. The method I used was similar to the "underlying numbers" method I employed last year, but some changes have been made. They include:

  1. Each team's expected shot differential was calculated on the basis of adjusted corsi - that is, overall corsi adjusted for how often each team played with the lead and trailed during the regular season. This is in contrast to last year's method, which used score tied corsi for this purpose. I elected to switch to adjusted corsi because it has more predictive power in relation to future results than both score tied corsi and overall corsi.
  2. I regressed each team's EV shooting and save percentage based on the extent to which the seasonal variation for each statistic can be attributed to non-luck. This differs from last year's method, in which each team was assigned a league average EV shooting percentage, with team EV save percentage computed on the basis of the overall career EV save percentage of the starting goaltender
  3. I regressed each team's PP and PK shot rates and percentages on the same basis as above when calculating each team's expected special teams scoring rates. Last year, I (erroneously) assumed no skill component for the percentages and elected not to regress shooting rates.
  4. Each team's expected PP and PK time on ice was calculated on the basis of it's predicted powerplay differential as well as its expected special teams scoring rates ( the latter adjustment is necessary given that a more efficient powerplay, as well as a less efficient penalty kill, will lead to fewer powerplay and penalty kill minutes, respectively). I actually performed the exact same calculation last year, with the only difference being the manner in which I determined predicted powerplay differential. Last year, raw powerplay differential was used. This year, powerplay differential was adjusted to reflect the percentage of team variation attributable to luck.
The application of the above method rendered the following expected winning percentages for each playoff team:


I then simulated each series 10000 times based on each team's expected winning percentage, which produced the odds displayed in the table at the top of the post.

In terms of predictive power, I have adjusted goal differential data for every season since the lockout (up to 2009-10), in which the adjustment was made using a similar but slightly different method than the one described in this post. I found that the adjusted goal differentials proved to be a superior predictor of the results of individual playoff games during that timeframe when compared to raw goal differential (empty netters removed).

I also found that the adjusted goal differentials better predicted how a team performed in the following regular season relative to raw goal differential.

I wanted to get this post up before the puck drop for Wednesday's games, so I wasn't able to include everything I wanted to content-wise. I plan to post cup probabilities and some more information relating to the method used to calculated the above odds.
.